
Profiling Ruby Code
02 Dec 2016This should be a small primer on how to profile Ruby/Rails code.
Tools of the trade
Thankfully, there are plenty of awesome gems to help us improve performance in Ruby apps. My particular favorites include:
-
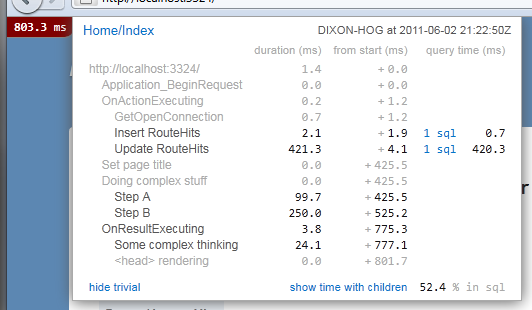
Shows a small speed counter, enabled for every HTML page in your app. Highly configurable and can even be used in production! Also has plugins to generate fancy flamegraphs, thanks to gems such as flamegraph and stackprof.
-
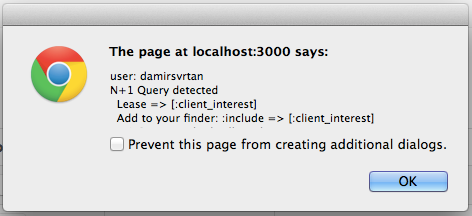
Warns you about N + 1 queries, unused eager loading, and probable cache counter performance optimizations. Can be configured to send notifications to multiple channels (e.g.: Growl, XMPP, Honeybadger, Bugsnag, Airbrake, Rollbar, Slack), and also raise errors if necessary (particularly useful in specs).
-
ruby-prof (MRI-only)
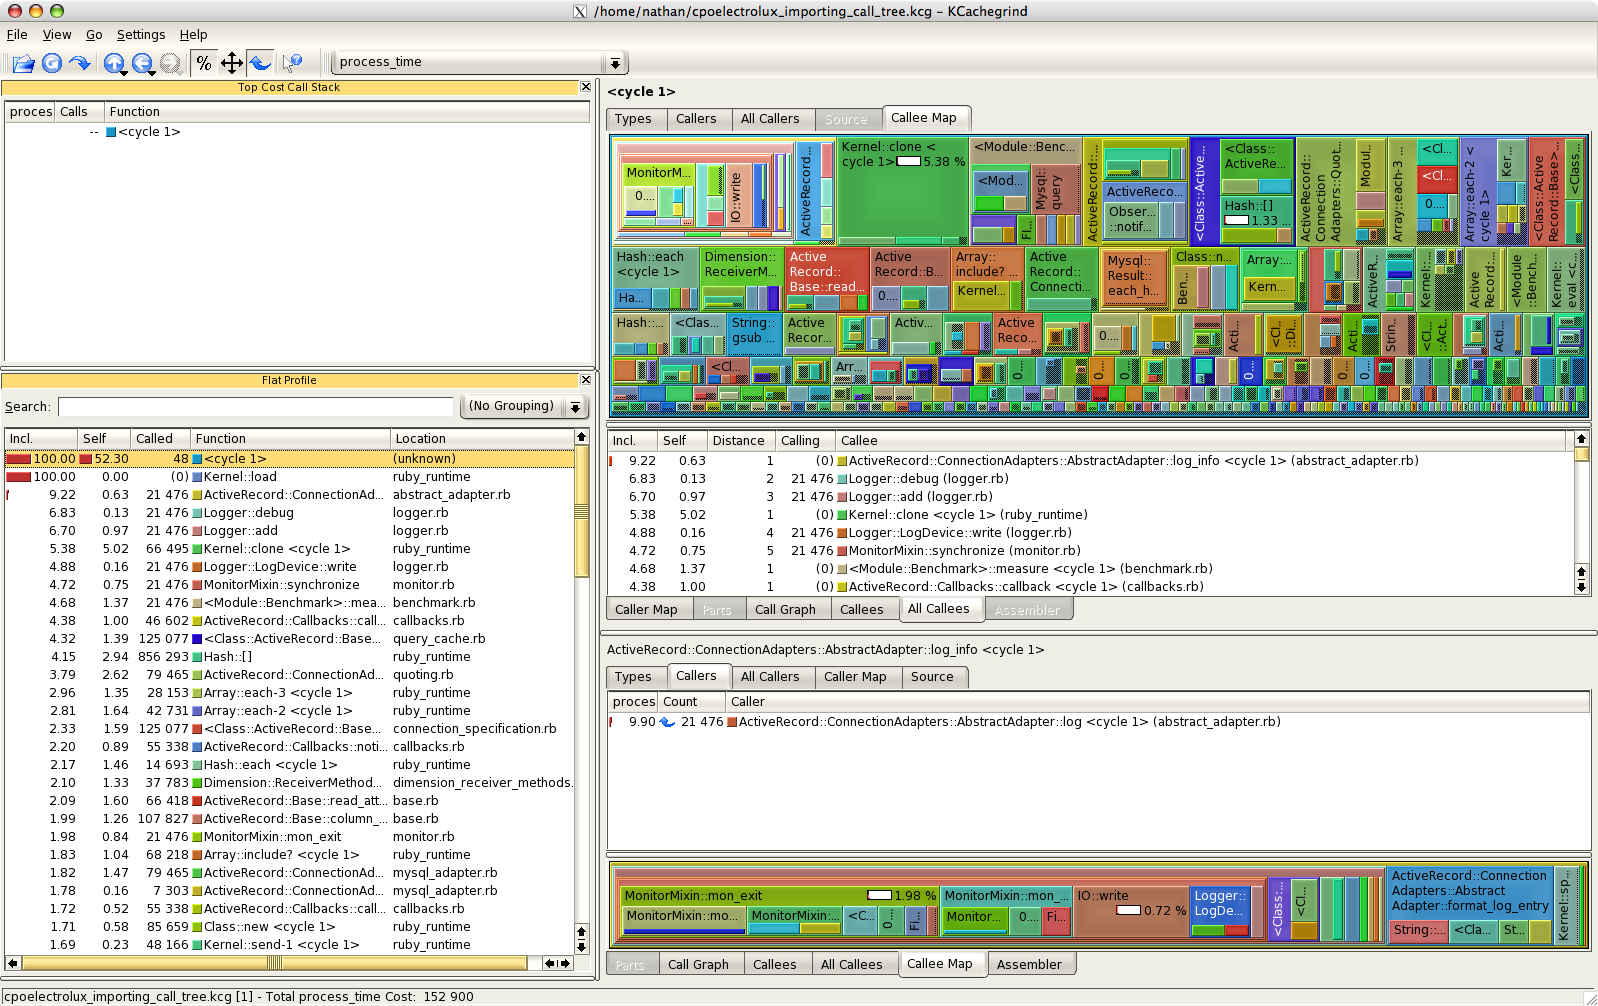
Code profiler that can output to many different formats, including the Valgrind calltree format (to be used by tools such as KCacheGrind) and graph profiles. It profiles multiple threads simultaneously.
-
Custom tracing code
If you want to try a poor-man’s version of the ruby-prof call stack, feel free to use this implementation (taken from this one and a little improved upon):
def trace(filename = '/tmp/trace', event_types = [:call, :return], *matchers)
  points = []

  tracer = TracePoint.new(*event_types) do |trace_point|
    if matchers.all? { |match| trace_point.path.match(match) }
      points << { event: trace_point.event,
                  file: trace_point.path, line: trace_point.lineno,
                  class: trace_point.defined_class,
                  method: trace_point.method_id }.merge(
        trace_point.event == :return ? { return: trace_point.return_value } : {}
      )
    end
  end

  result = tracer.enable { yield }

  File.open("#{filename}.rb_trace", 'w') do |file|
    points.each do |point|
      event_prefix = point[:event] == :return ? 'return' : 'call'
      return_value = point[:return] ? "(#{point[:return]})" : ''
      file.puts "#{point[:file]}:#{point[:line]}:#{event_prefix} #{point[:class]}##{point[:method]} #{return_value}"
    end
  end

  result
end
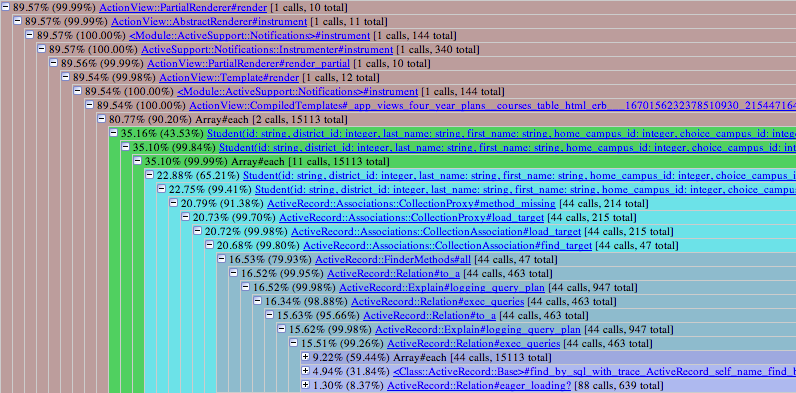
This works wonders with Emacs’ grep-mode, it’s very IDE-like. Kinda like this:
Testing for performance
There’s good advice in the Rails performance guides.
Only thing I want to add is that the performance tests only make sense if they’re run consistently in similar machines (or, even better, always the same one), otherwise you run the risk of getting different results based on hardware, system load and other sources of noise. It pays to establish the most isolated environment possible here - refer to your CI documentation for that.
Fixing a bottleneck
My favorite method is: profile, analyze results, make the smallest changes that seem to fix the problem, rinse and repeat. Never assume you know what the bottleneck is - you’ll be surprised with real life.
That being said, here are some common tips to fix degraded performance in apps:
-
Choose good algorithms
No way to squeeze performance out of a bad algorithm, even if you’re writing it in hand-optimized assembly. Be wary of O(n^2) algorithms for seemingly-simple things, iterating over map-like structures, and things like that.
One caveat: sometimes an algorithm has good worst-case bounds, but its performance characteristics only show up for very large input values. In this case, it’s usually better to use a “worse” algorithm that fits your usual input.
-
Lazily evaluate what you need
Got the result you want? Good, now break out of the loop you’re in. Seems simple, but sometimes it’s the cause of very degraded performance.
Also, you can use the Enumerator class to stream potentially long operations. Or, if you’re lucky enough to be writing Haskell, the language does that for you!
Main takeaway here is: do not run any code you don’t need to.
-
Cache expensive results
If you have an object that looks like a pure function, you can usually cache its results, and save these cycles for other operations. It trades CPU for memory, but that is usually a valid tradeoff.
-
Push very expensive operations to background jobs
If you’ve done all of the above and the app still does not perform as you would like to, try to push slow operations to background jobs. If you don’t have a hard requirement to recalculate this data on-the-fly (this is particularly true of complex metrics), this approach can work wonders.
Useful bibliography
Refer to these to get a better grasp of performance improvements for your Rails app:
- Systems performance
- Anything else by Brendan Gregg, author of the book above. I’m particularly fond of this article about GDB that helped me debug issues with my Emacs install.
- This post on Rails caching
Conclusion
Hopefully, you now know how and where to start optimizing after reading this article. If there’s interest, I can write more detailed articles explaining each of the layers of a performance optimization job - from profiling to tuning different aspects of the Rails app (SQL queries, ActiveRecord, view logic, assets delivery, front-end code, protocols).